Discovering Common Emotional Arcs in Movie Plots Using NLP and Clustering
What if you could visualize the emotional journey of a movie? And what if you could find recurring patterns across thousands of films? In this project, we used sentiment analysis, time series normalization, and clustering to uncover common emotional arcs — just like Kurt Vonnegut described in his famous lectures on story shapes.
Quantifying Emotional Valence: The Metric of "Fortune"
To quantify the emotional trajectory of a story, we rely on a metric we call fortune — a continuous score that captures the sentiment or mood of a piece of text. Using the VADER sentiment analyzer from vaderSentiment, each chunk of a movie plot is assigned a compound sentiment score in the range [-1, 1]:
- +1: Extremely positive sentiment (joy, triumph)
- -1: Extremely negative sentiment (tragedy, despair)
This allows us to model a movie plot as a time series of emotional sentiment — a so-called emotional arc.
From Plot Text to Emotional Arcs
The steps we followed:
- Chunk the plot: Split the full plot into windows of ~5 sentences.
- Score each chunk: Apply VADER sentiment analysis to get a "fortune" value.
- Smooth and normalize: Use
gaussian_filter1dand linear interpolation to normalize each arc to 50 evenly spaced time points.
Clustering Emotional Arcs
With a matrix of movie arcs (each 50-dimensional), we use KMeans clustering to discover common emotional shapes. Each cluster centroid represents an archetypal emotional journey.
Why KMeans?
KMeans finds centroids that minimize the Euclidean distance to each arc. This is ideal for identifying "average shapes" of sentiment movement through a story. We set k = 6 to mirror Vonnegut’s classic story shapes.
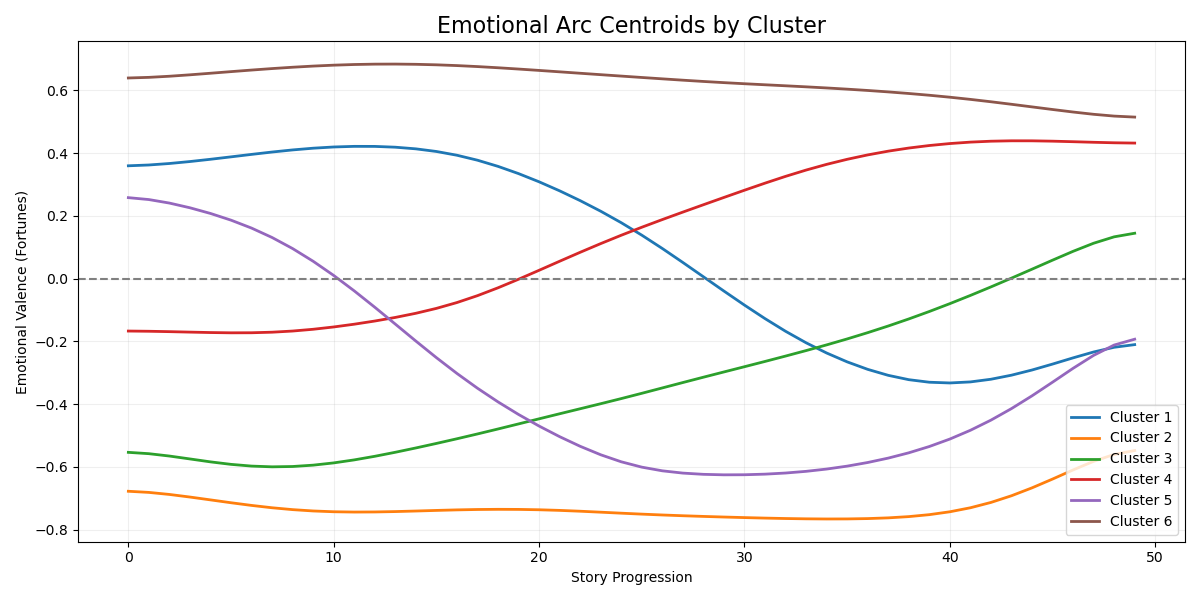
Visualizing Story Shapes
Each cluster represents a distinct shape — like "Rags to Riches", "Tragedy", or "Man in Hole". We plotted the cluster centroids to visualize these shared trajectories.
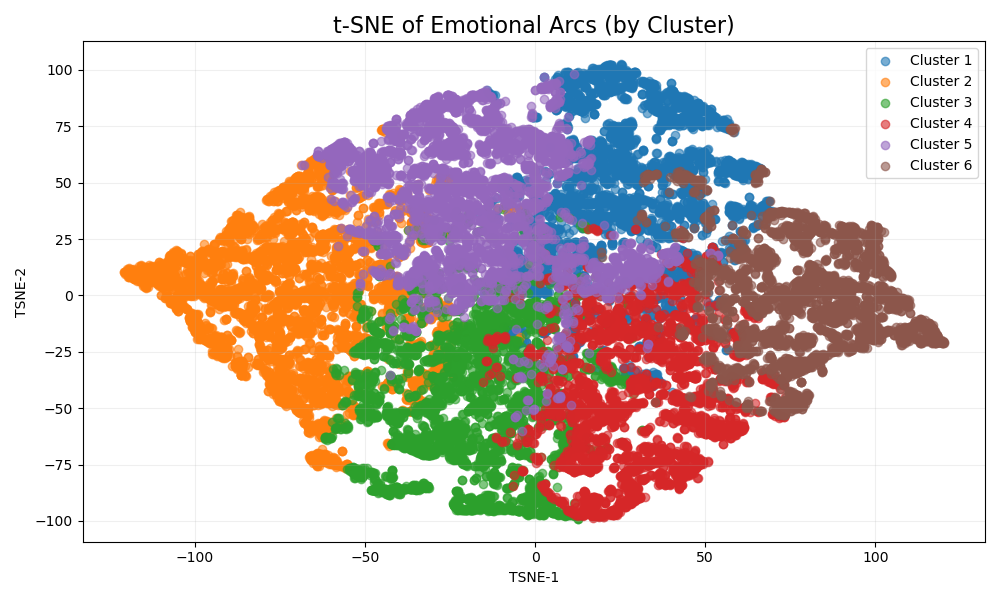
Adding Interpretability with t-SNE
To better understand the relationships between arcs, we applied t-SNE, a dimensionality reduction technique. This maps high-dimensional arcs into 2D, letting us visually cluster arcs and explore their distribution.
Interpreting the Clusters
Based on the actual shape of the cluster centroids, here is our refined interpretation of the six emotional arc types:
- Cluster 1 – "Fall from Grace": Starts positively but descends into a deep emotional decline, representing tragedy or moral collapse.
- Cluster 2 – "Flatline with Redemption": A mostly negative and flat emotional tone with a hopeful uptick at the very end.
- Cluster 3 – "Redemptive Rise": Begins with emotional turmoil and rises toward a positive, redemptive conclusion.
- Cluster 4 – "Tragic Slide": Starts fairly neutral and then steadily declines into emotional darkness without recovery.
- Cluster 5 – "Rollercoaster (Cinderella)": Features a rise, steep fall, and a final resurgence — mimicking stories of recovery or resurrection.
- Cluster 6 – "Consistent Uplift": Maintains a strong positive tone throughout, slightly increasing — a hallmark of feel-good, optimistic stories.
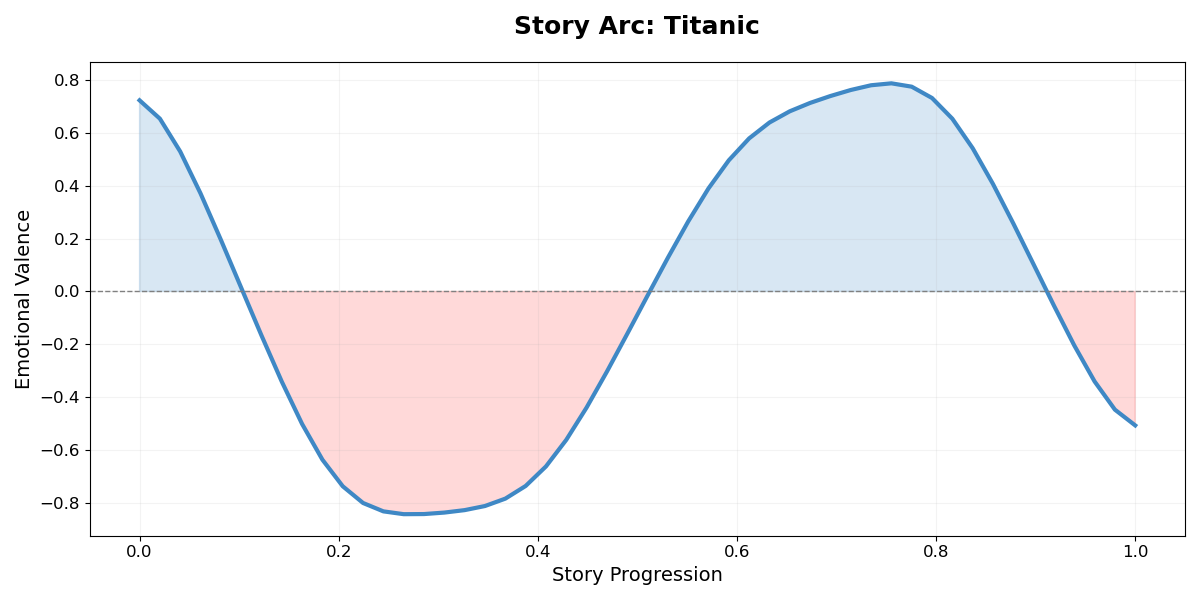
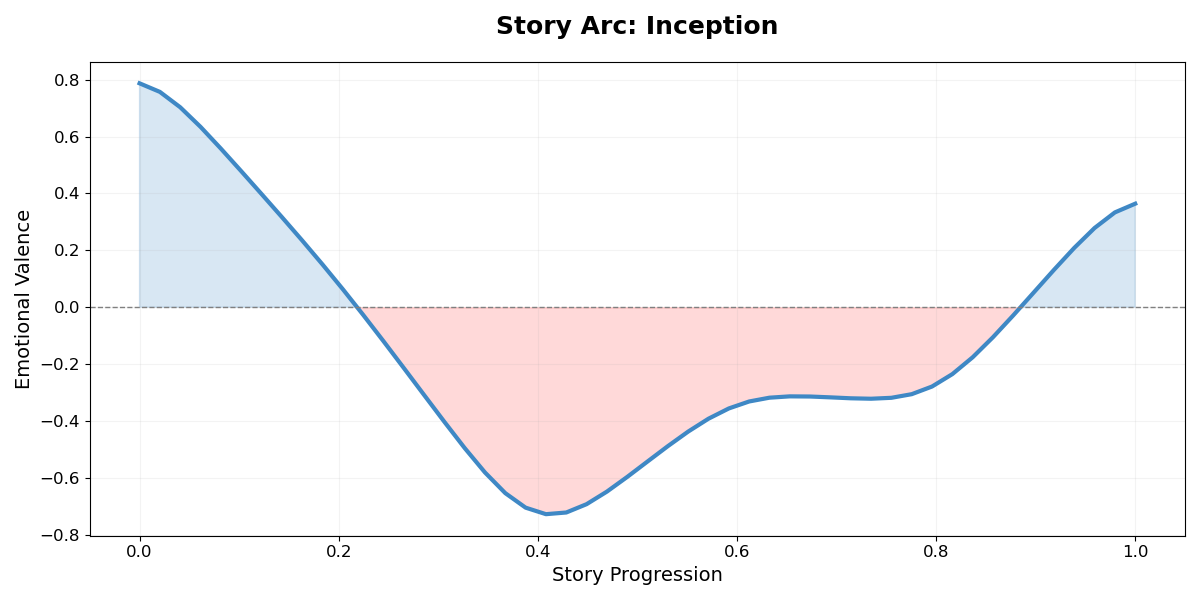
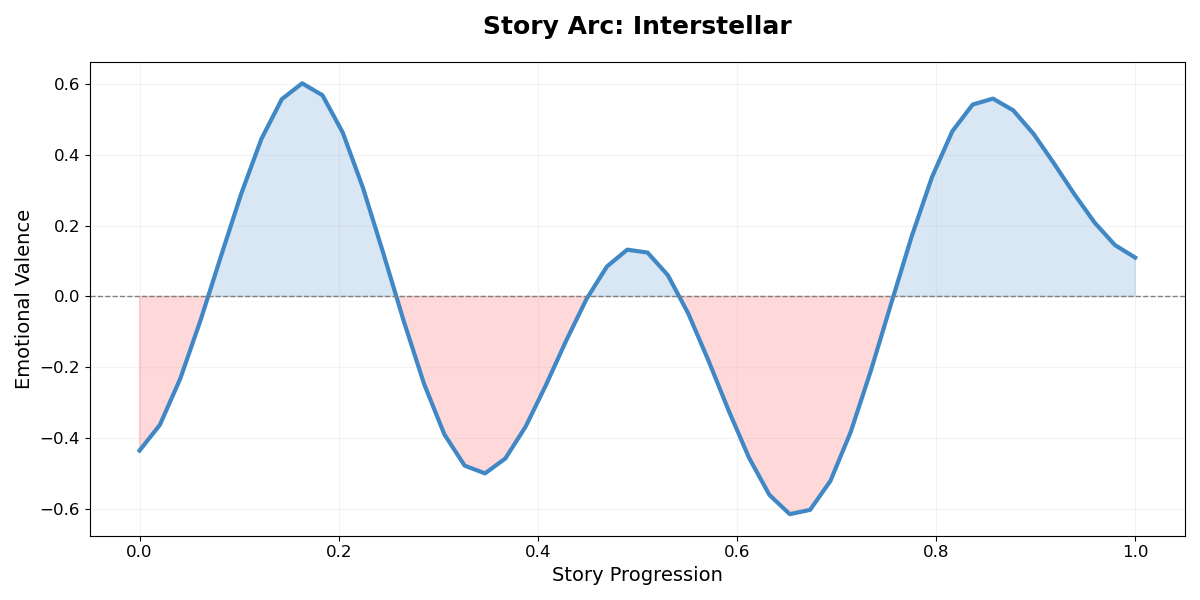
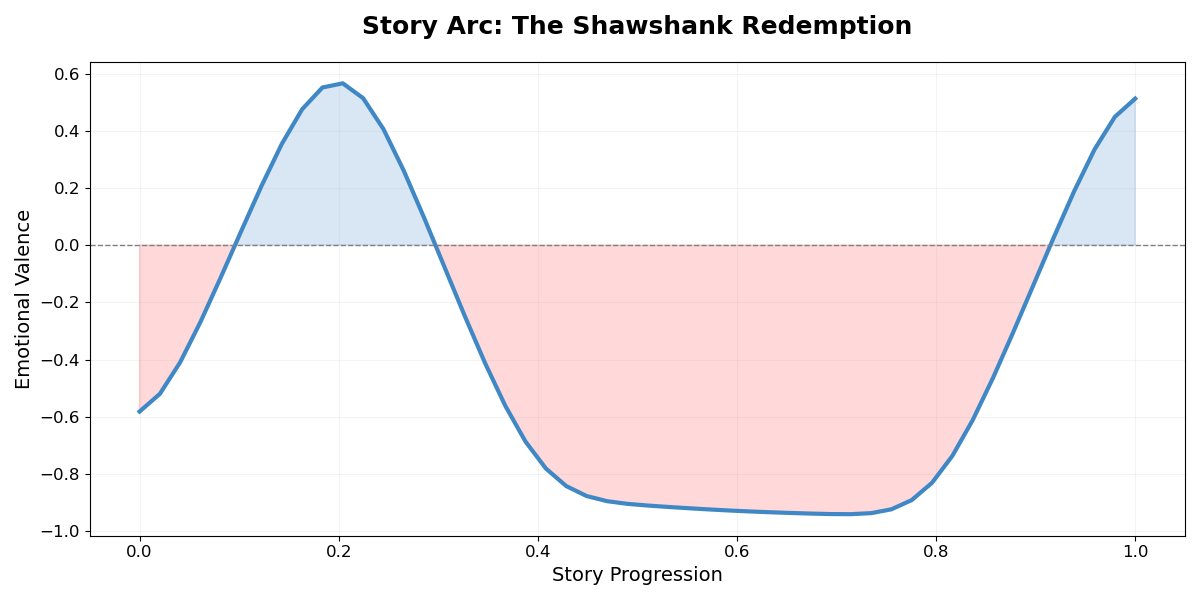
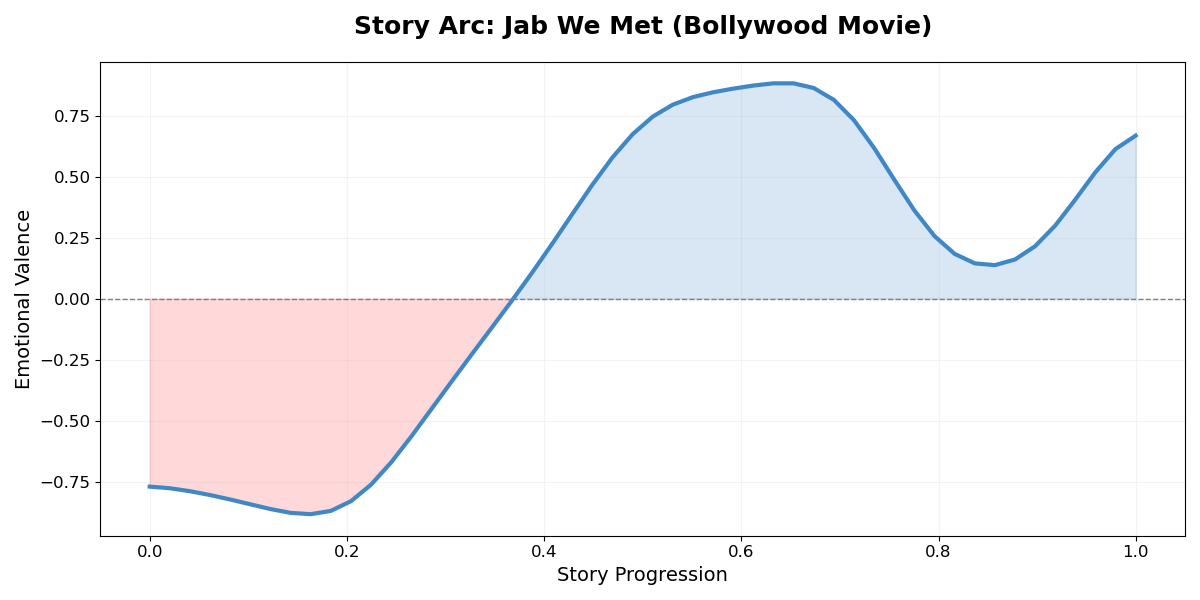
Emotional Arcs of Notable Movies
To make this more tangible, here are the emotional arcs of some iconic movies, generated from their plot summaries:
Conclusion
By modeling emotional progression with sentiment analysis and clustering, we’ve captured and categorized narrative shapes across thousands of movies. This technique could power tools for screenwriters, recommendation engines, or even AI storytellers.
Next Steps: Label clusters with story shape names, correlate arcs with genres, or use these arcs to recommend stories with a desired emotional feel.
If you'd like to explore the source code, the code is available on GitHub.