Capture Heatmaps for Chess Pieces using Lichess Game Data
Project Description
This project investigates the spatial dynamics of chess captures using a large-scale dataset of games from Lichess.org . We developed a Python-based analysis pipeline that parses Standard Algebraic Notation (SAN) game logs, reconstructs board states, and logs where each of the 32 individual pieces is most frequently captured. For kings, since they are rarely captured, we instead log their final square at the end of the game.
Objectives
- Parse and analyze historical Lichess game data
- Track and record the capture positions for each unique chess piece
- Produce static and interactive heatmaps that reflect positional vulnerability
- Embed the visualization in an interactive dashboard
Methodology
Each game’s move history is parsed using python-chess, a robust library for SAN parsing and move validation. All pieces are initialized with unique labels derived from their color, type, and starting square. Captures are detected during move processing and recorded into an 8×8 matrix per piece, indexed by board coordinates.
We store these matrices as NumPy arrays and use matplotlib for static board-styled heatmaps. For interactive exploration, plotly is used to build a dropdown-based web viewer that allows users to switch between pieces and inspect square-level statistics interactively.
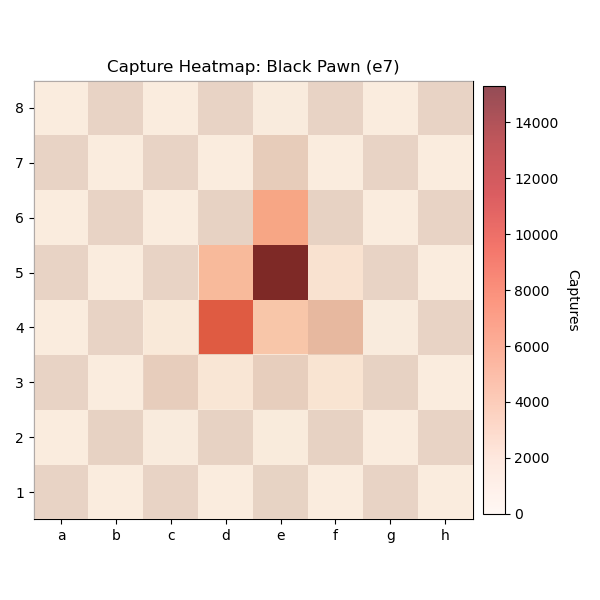
Black Pawn on e7
This heatmap shows the capture patterns and frequencies for the black pawn that begins on e7:
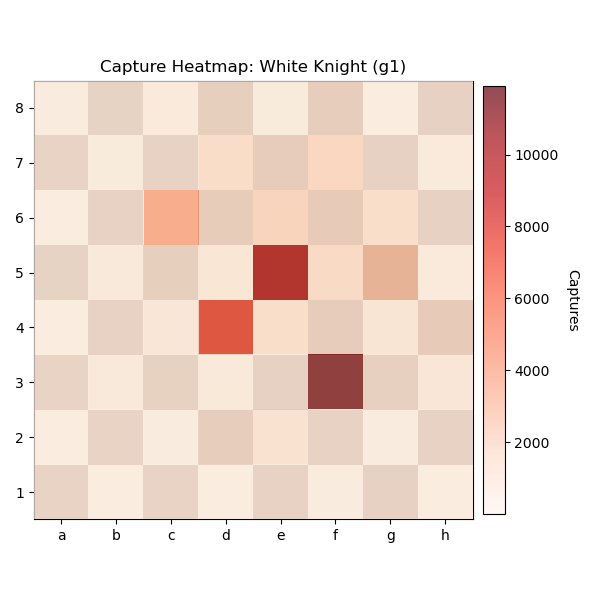
White Knight on g1
This heatmap shows the capture patterns and frequencies for the white knight that begins on g1:
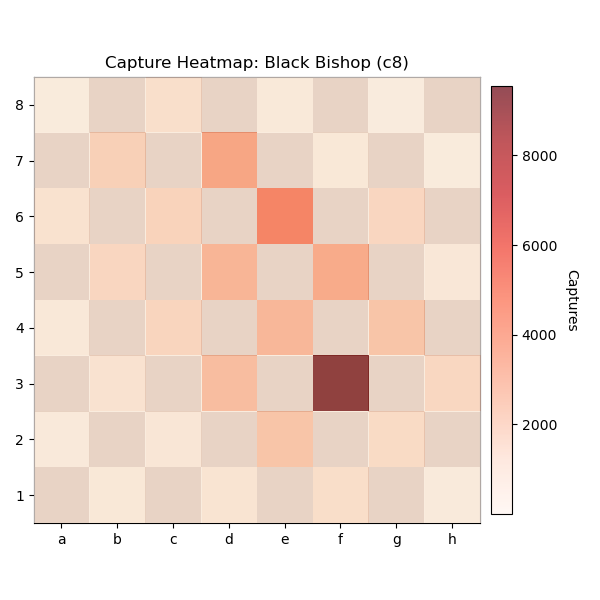
Black Bishop on c8
This heatmap shows the capture patterns and frequencies for the black bishop that begins on c8:
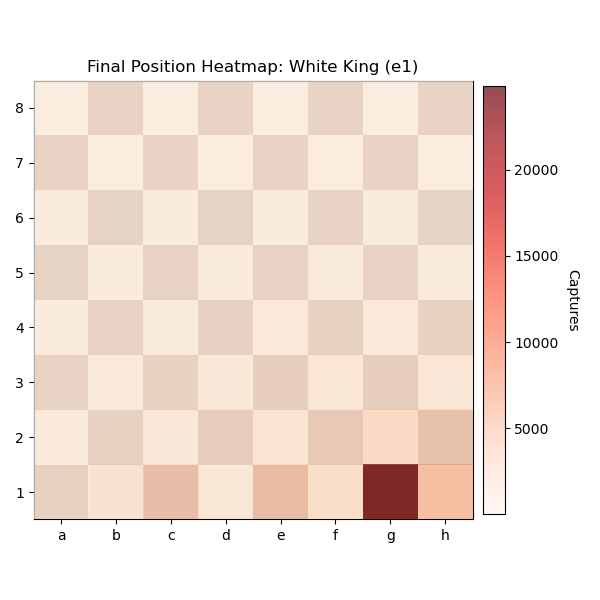
Final Position of White King
Instead of plotting capture squares for the kings, which is extremely rare, we map the final square of the king at the end of each game. This visualizes king safety and castling patterns.
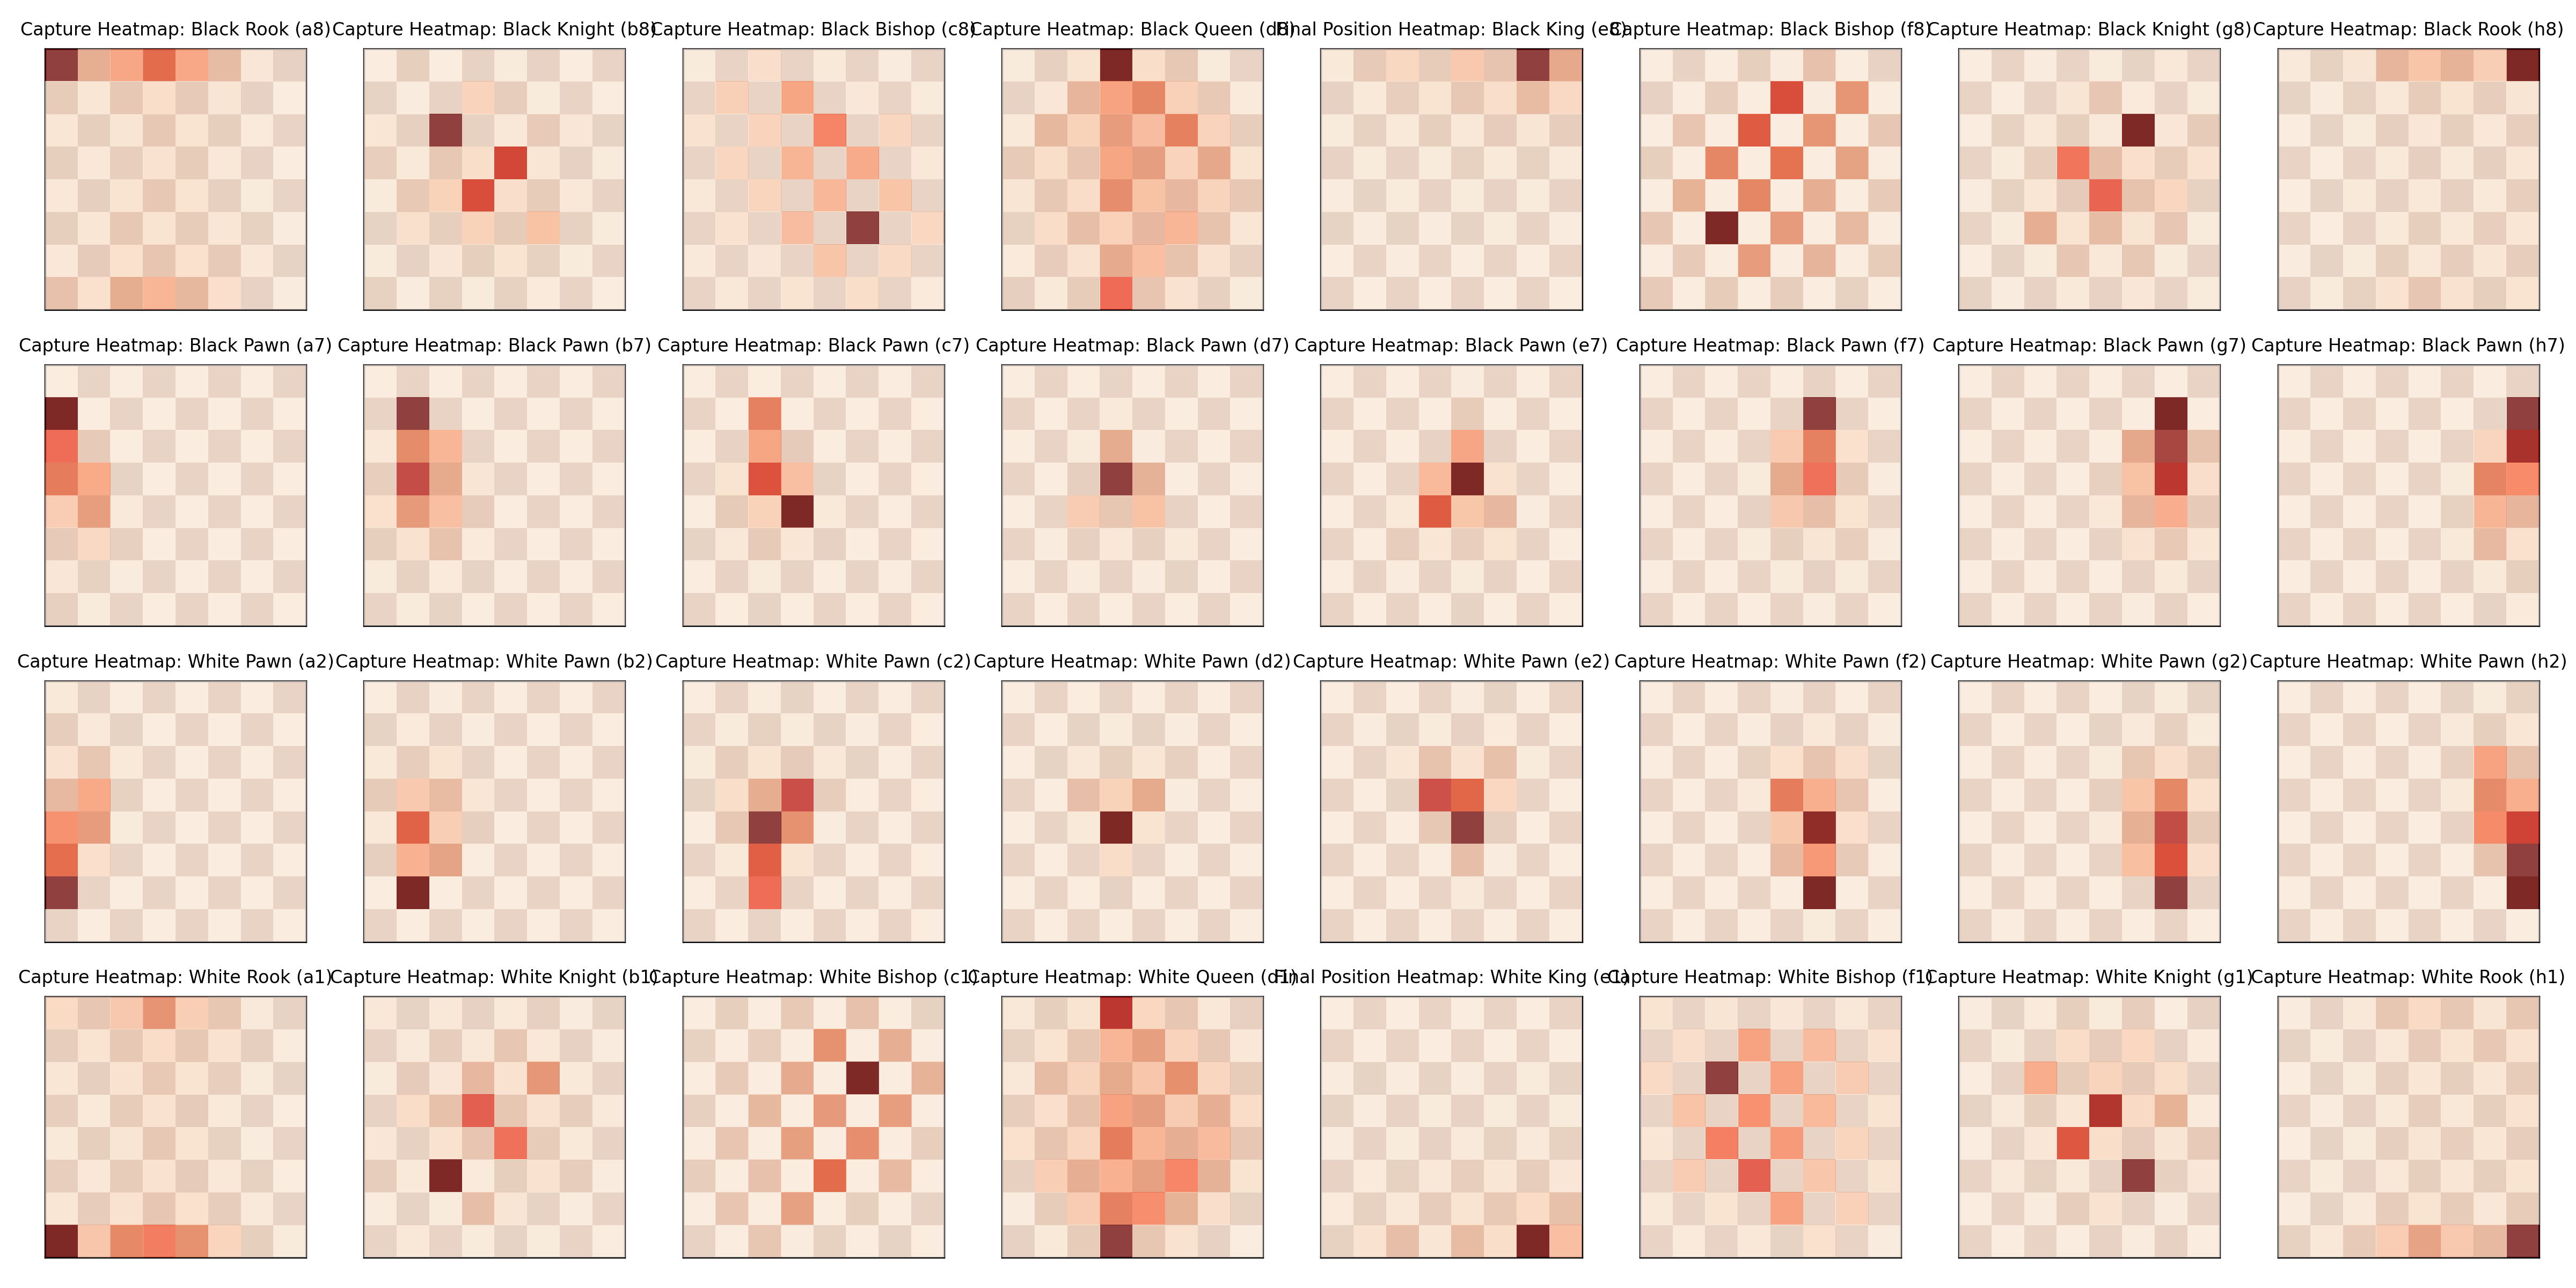
Aggregate Grid
The following composite visualization aligns all 32 piece heatmaps in their natural board positions. This facilitates piece-to-piece comparisons and reveals macro trends.
Key Insights
1. Opening Repertoires Leave Strategic Signatures
Capture footprints of central pawns—especially those on e2/e7 and d2/d7—demonstrate opening preferences. White's e2 captures show pressure on d3, d4, f3, and f4—classic of open games: Ruy Lopez, Italian Game and the Scotch .
Black’s pawns strike further into White’s half, reflecting counterattacking setups in the Slav, French, and Caro-Kann.
2. Subtle Asymmetries in Piece Activity
Rooks and bishops exhibit unexpected activity profiles. White's kingside rook (h1) is more active than Black's h8, likely due to more frequent castling and open file tactics seen in London, Colle, and KIA systems. The Black f8 bishop shows higher diagonal aggression, consistent with KID and Grünfeld dynamics where fianchetto structures dominate.
3. Knight Heatmaps Confirm Central Outpost Strategy
Knights show clustered captures around e4, d4, e5, d5. White prefers f5/d5, consistent with IQP and Anti-Sicilian pressure. Black favors c4/e4—strongholds in the Benoni, Nimzo-Indian, Grünfeld. Centralization isn’t just theory—it manifests in data across thousands of games.
4. Queen Activity Is Diagonally Skewed
Surprisingly, queens show diagonal capture densities—not just file control. The Black Queen captures often on c3, h4, e5; White's queen finds diagonal activity post Qb3, Qh5—consistent with sharp tactical lines in the Scandinavian, Trompowsky, and Vienna.
5. Kings Reflect Game Conclusions, Not Endgame Phases
King heatmaps (from final positions) reveal that most games end with the king near its castled location. Full endgame king centralization is rare, reflecting online time controls and tactics-heavy games that rarely reach pure endgames.
6. Flank Pawn Anomalies and Unorthodox Lines
g2/g7 and h2/h7 pawns show surprising capture frequency, suggesting flank pushes or gambits such as the King’s Gambit, Wing Gambit, and aggressive flank expansions. These heatmaps suggest greater diversity and novelty in online games, especially in rapid formats.
Interactive Dashboard
You can interact with the following embedded heatmap viewer. Use the dropdown to select a piece and explore its square-by-square capture frequency.
By converting raw game move logs into structured spatial data, we gain valuable insights into how and where pieces are typically lost. These heatmaps provide tactical awareness for players, and the system can be further extended for opening-specific analysis, player rating trends, or even live game augmentation.
If you'd like to explore the source code or apply the analysis to your own PGN data, the code is available on GitHub.